Real Estate Investing – Market Intelligence
Real Estate Investing – Market Analysis
One of our clients wanted to identify opportunities for real estate investing.
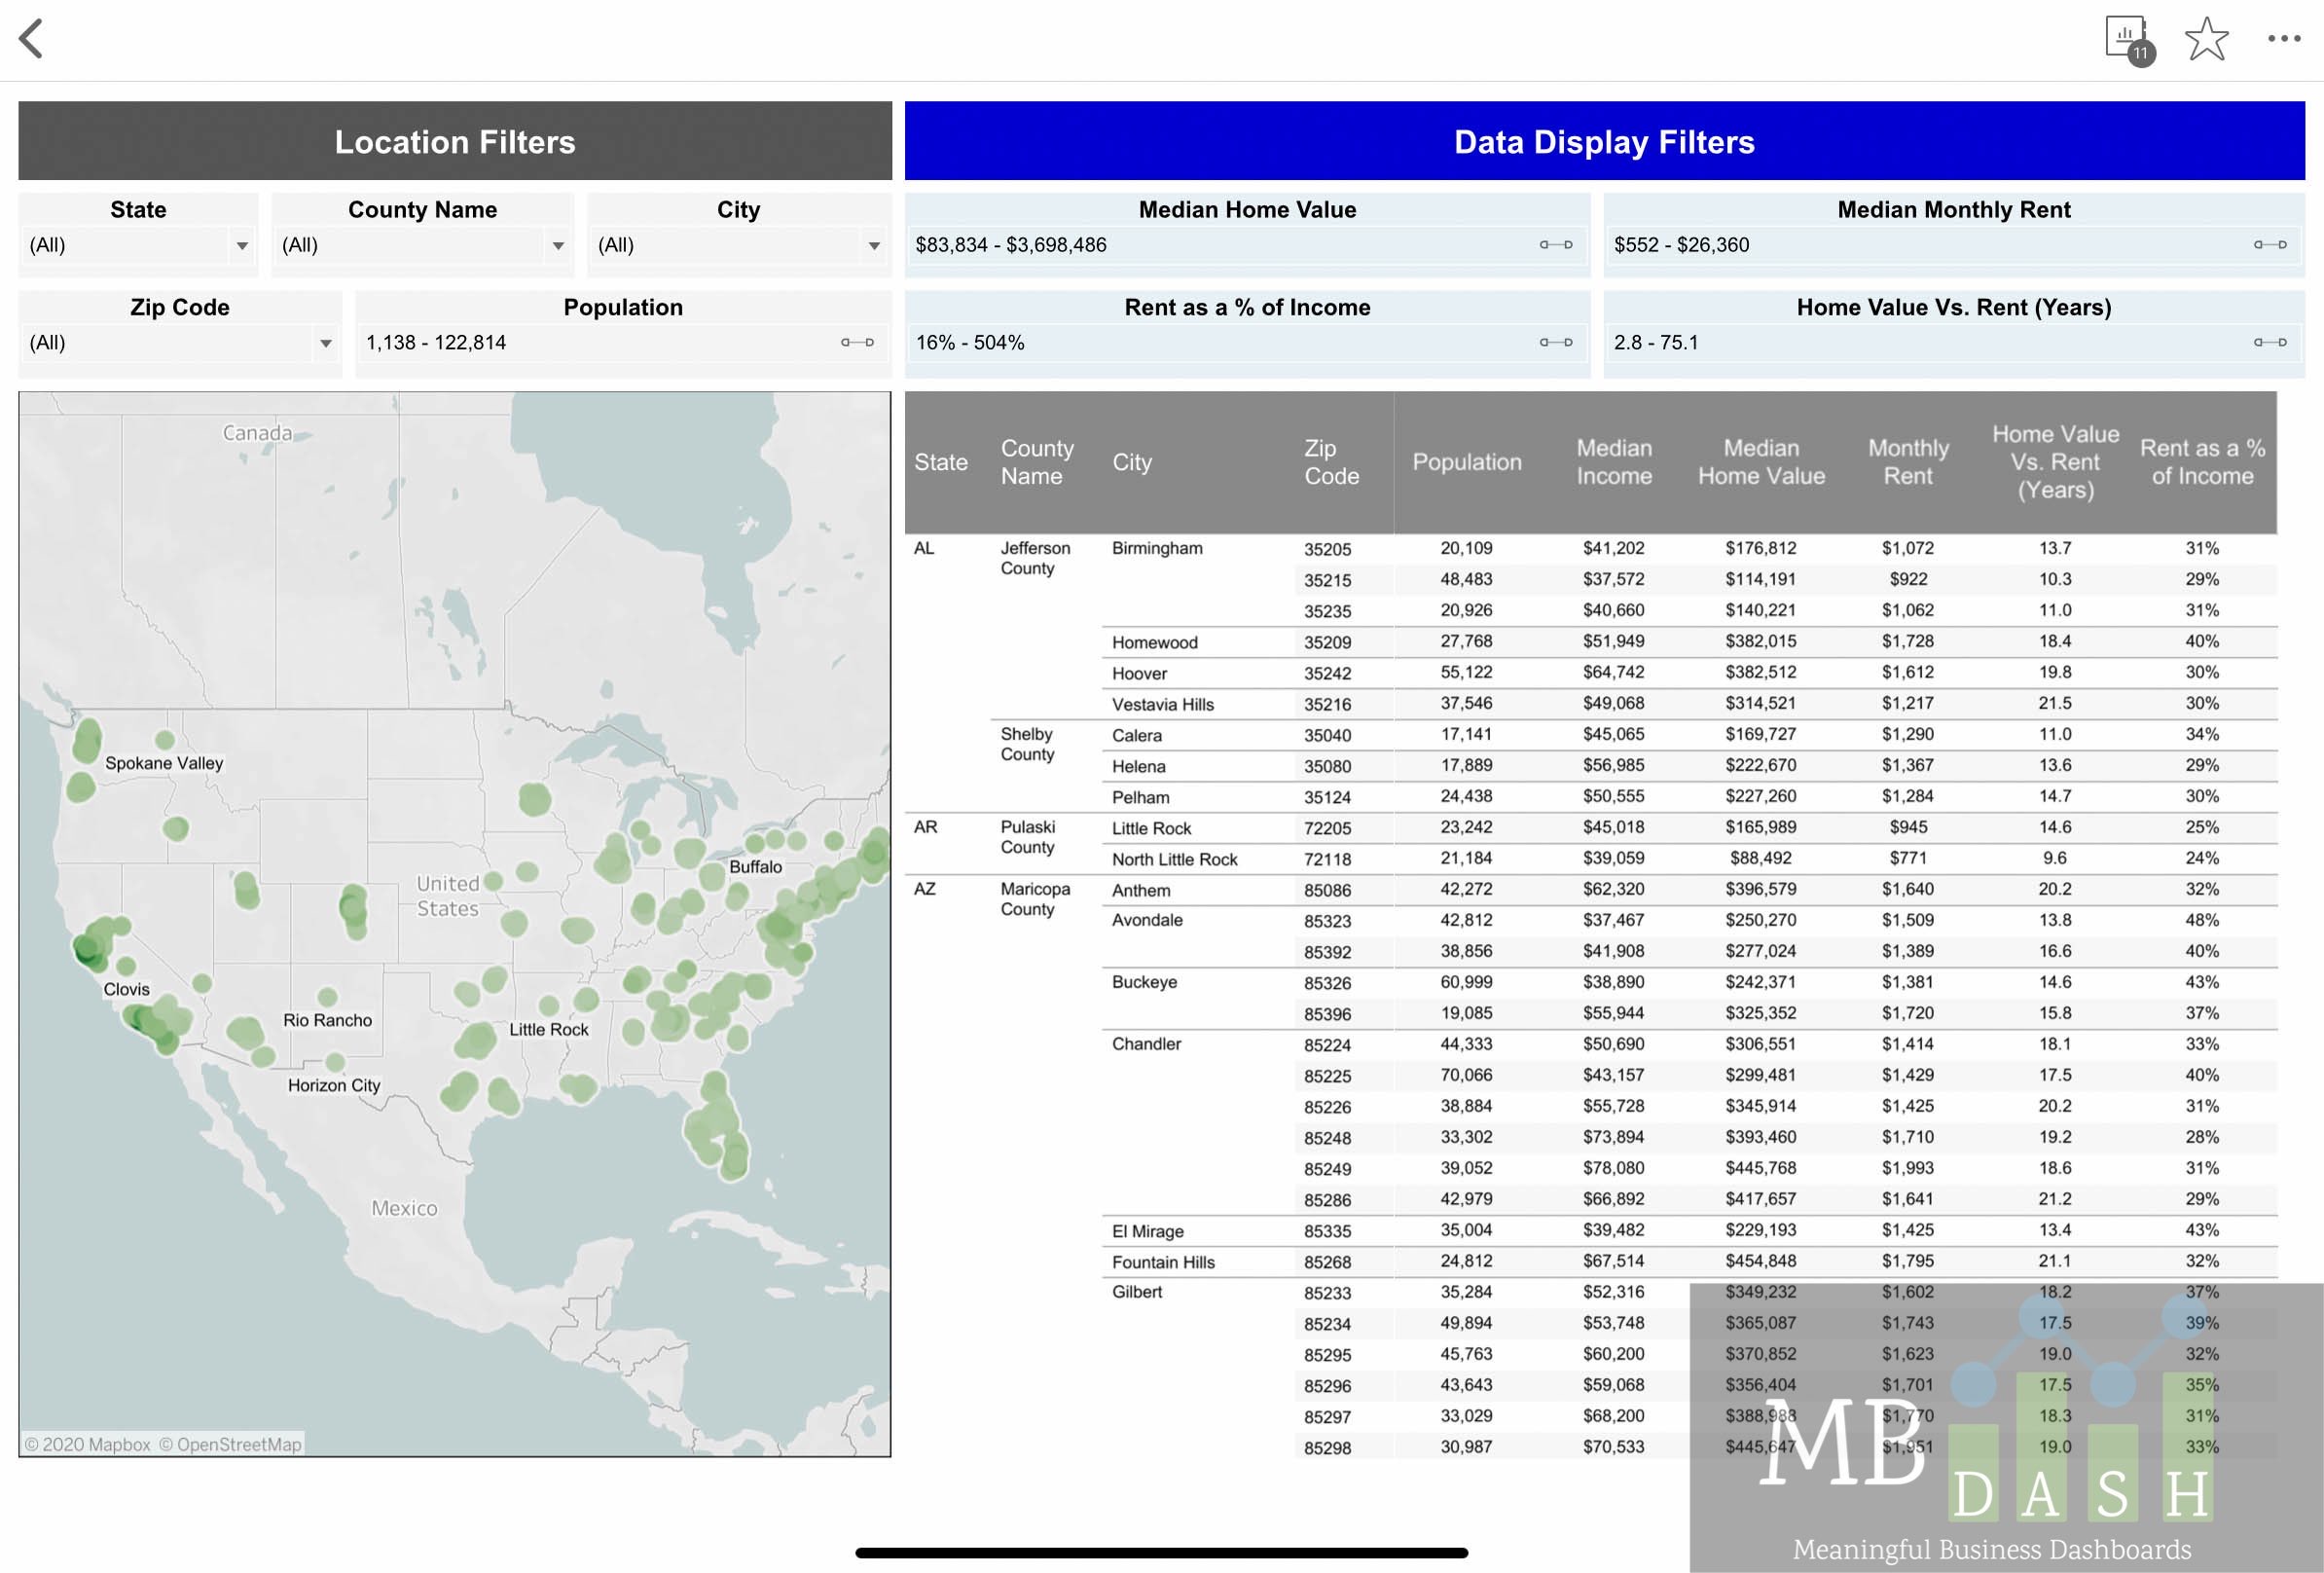
One of our clients wanted to identify opportunities for real estate investing.
Our sales agent dashboards allows your sales agents to quickly see their sales performances. We provide a fully customized option for your sales team and/or business. You decide what KPIs and information is displayed for your sales agent. With the interactive sales agent dashboard, your team is able to quickly drill in and see more information.
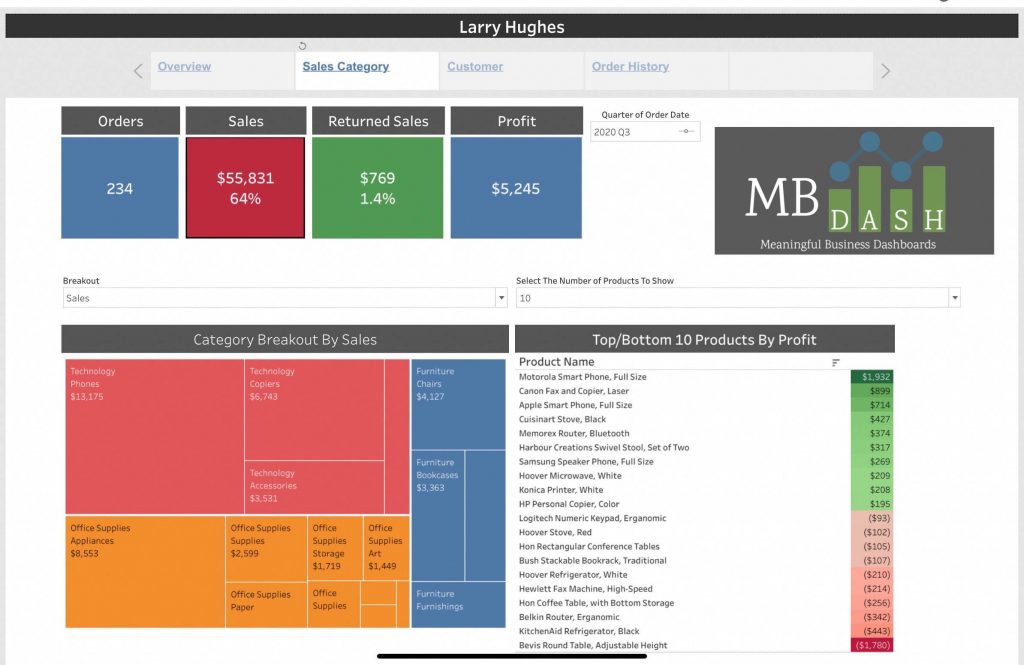
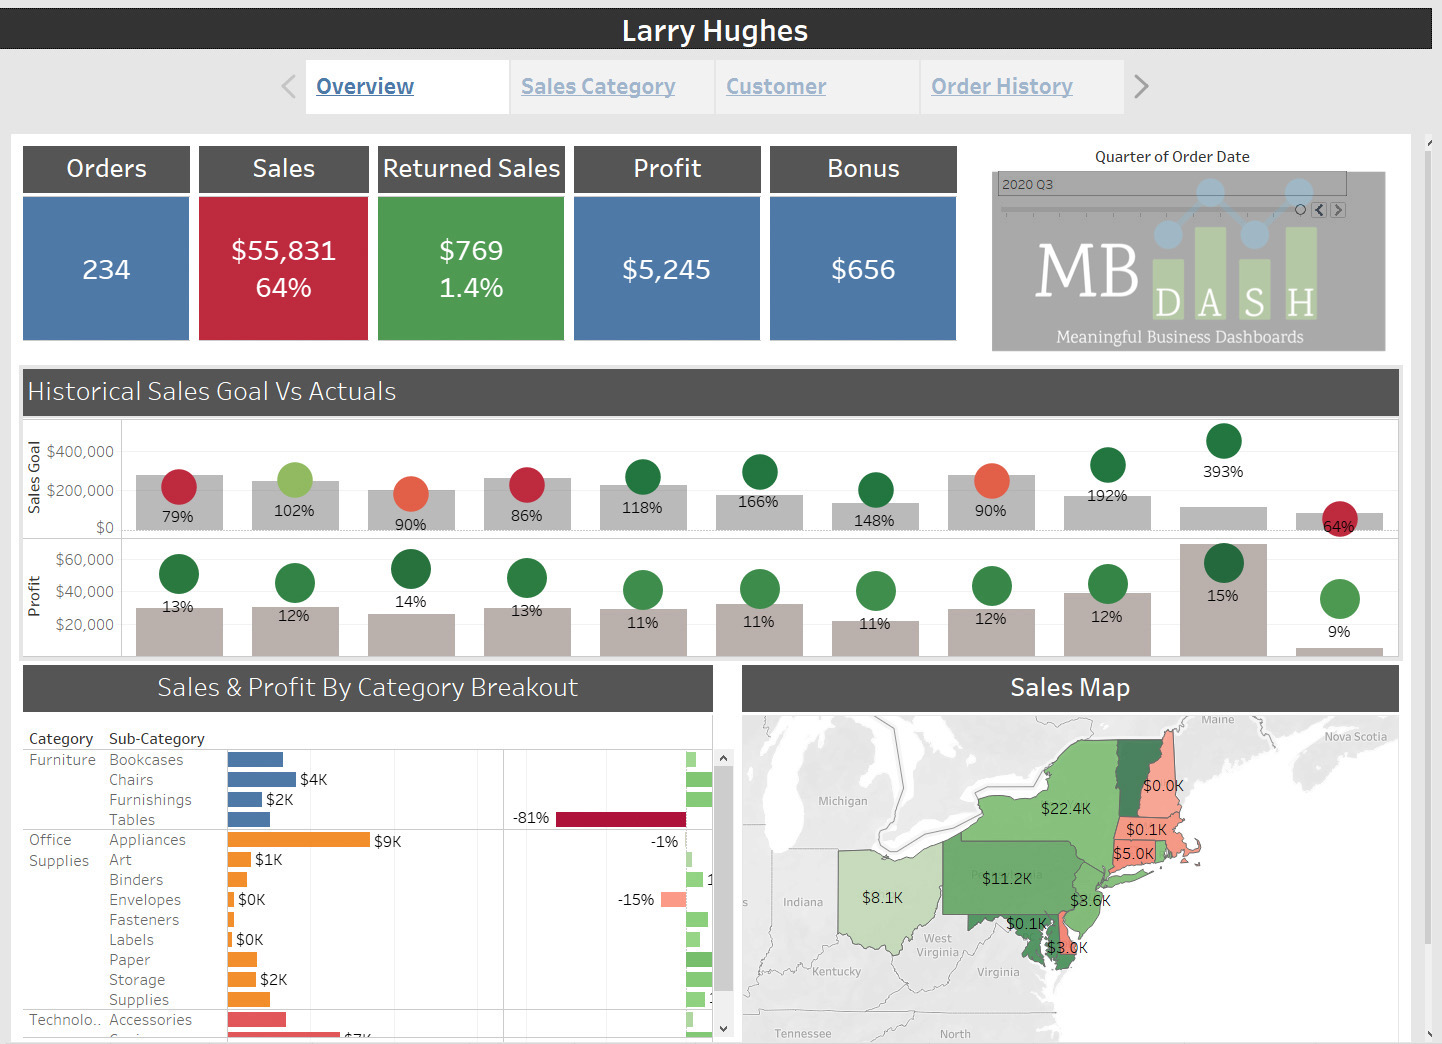
The overview is designed to let the sales agent quickly determine their performance.
For this client we decided the 5 best KPIs: Orders, Sales (with goal achieved), Returned Sales (with % of returned sales), Profit, and Bonus. The Sales and Returned Sales are setup to display Green/Yellow/Red depending on values.
Historical Sales Goals Vs Actuals and Profitability. This allows the sales agent to view historical sales and profitability in one quick view.
Sales & Profit By Category Breakout: This information is broken out by Sub-Category showing the sales and profit from each area. For this client the sales agents bonus is calculated using total profit and sales. This view helps the sales agent see which categories they should push to increase their bonus.
Sales Map: Since the sales agent’s territory is broken into a US Region, we have broken out the sales by state. This can also be broken out by County, City, and Zip code.