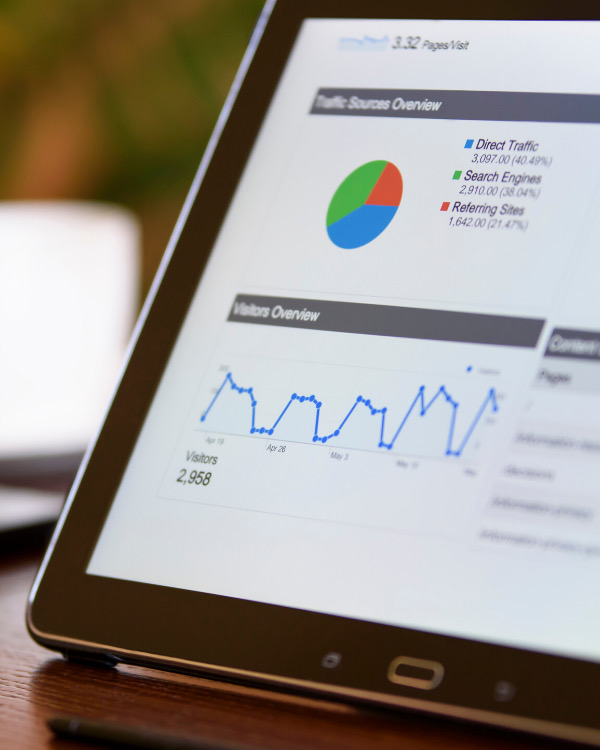
Tableau is changing the way the world sees and understands data. Tableau allows you to combine data from a number of different sources into a single dashboard. This allows you to view your Key Performance Indicators in one centralized location.
Did you know?
0%
of all data has been created in the last 2 years
0%
of Companies aim to be data-driven
0%
of the data is analyzed and used
Services We Offer
Data Preparation
To achieve valuable business intelligence, we make sure that data is well organized before visualizing it. Collecting data from different sources (Excel Spreadsheets, Databases, Cloud API) and converting it into clean and meaningful information is critical for your business.
Data Visualization (Tableau)
We generate customized and interactive Tableau Software Dashboards for you to see and understand your data from any device. Captivate a huge quantity of information and interacting directly with your data has never been so simple
Assistance (Support, Enhance, Train)
To create world class Tableau dashboards and consistently deliver high-quality end to end data visualization solutions to our clients is our number one priority. We also offer ongoing support, on-demand data enhancement solutions and training on Tableau Software